DATAXPLORER BUILDER · OPEN DATA PORTAL
Create High Impact Data Driven Stories.
Dataxplorer is a beta-stage platform that helps mission-driven organizations move from raw data to visualizations faster. We centralize data from 100,000+ sources and let you create charts without switching tools.
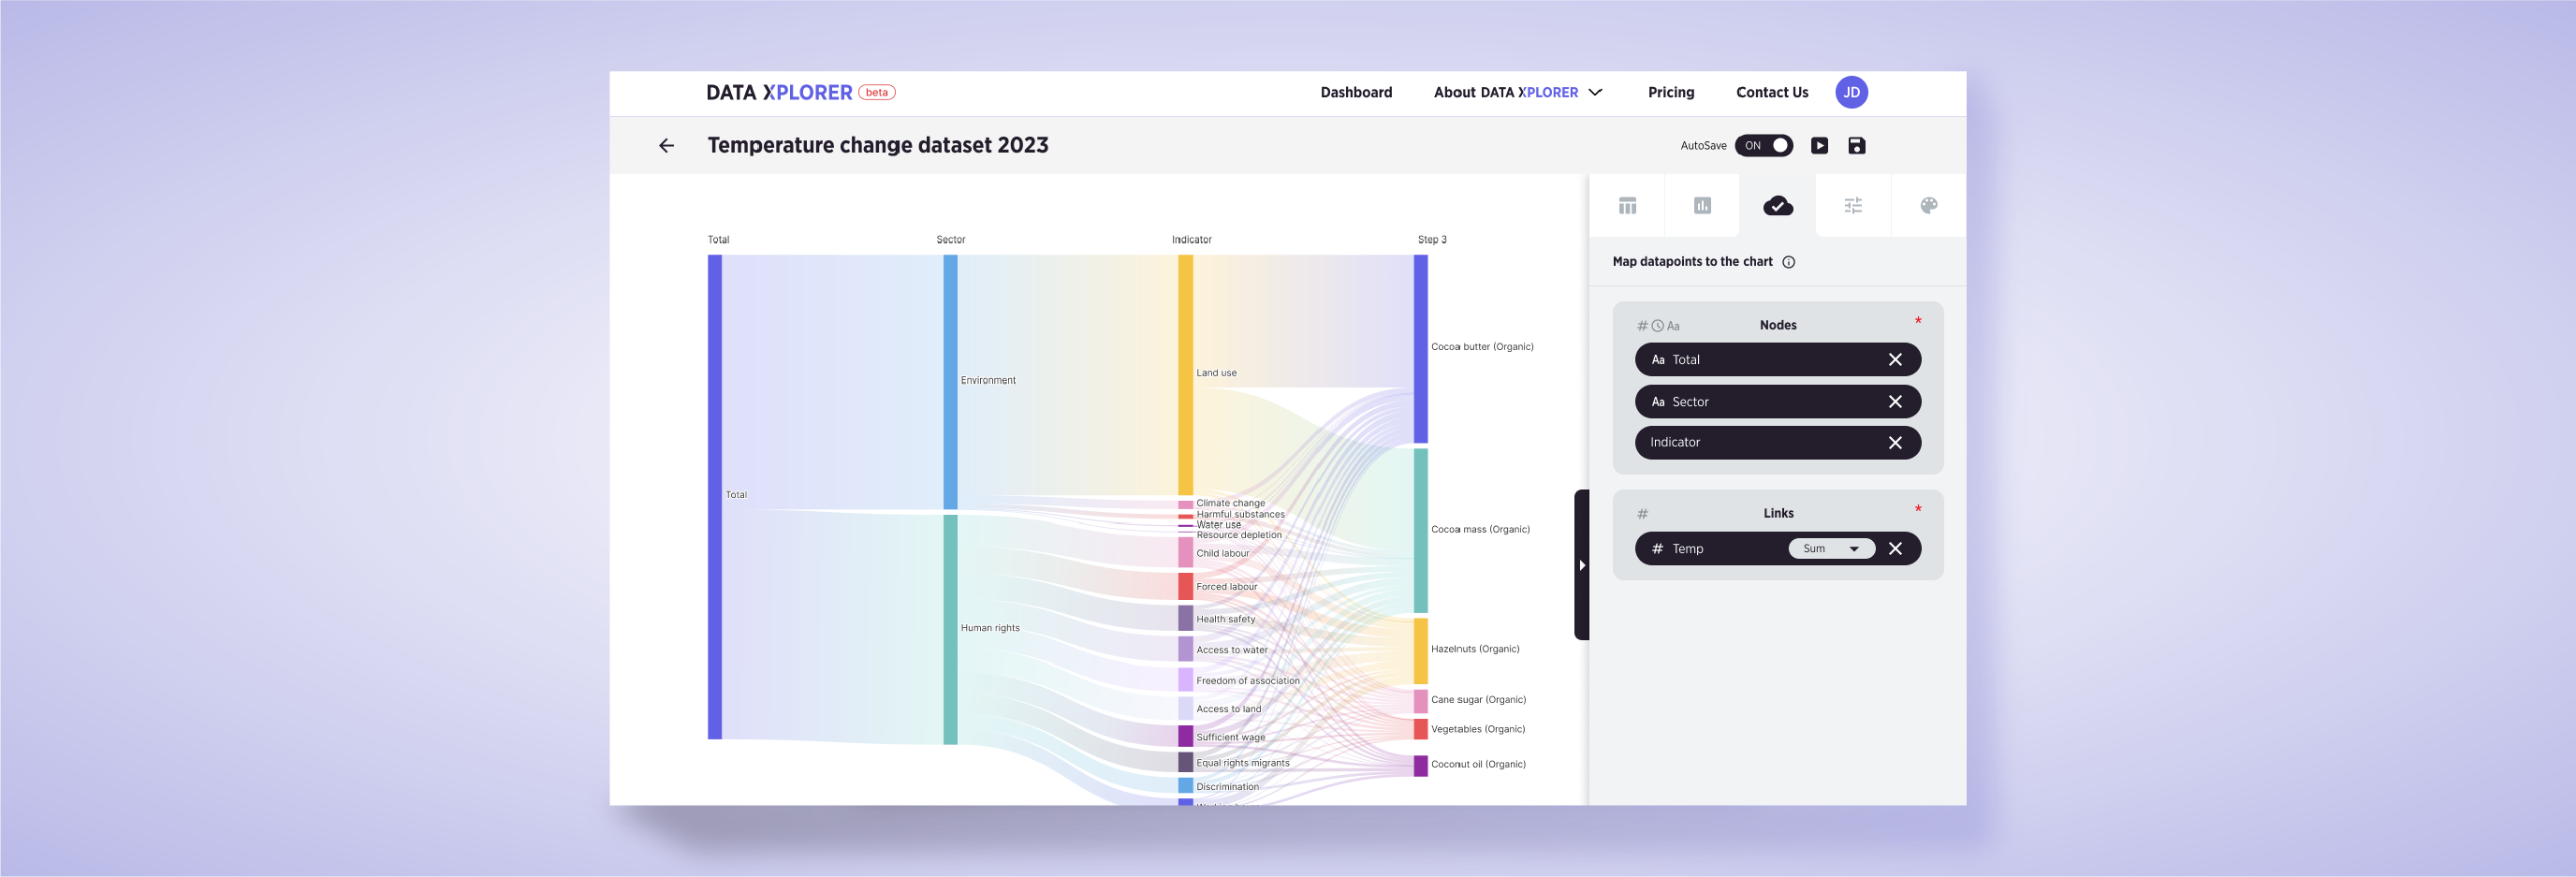
In-House Product (Zimmerman)
Product Development, UI/UX Design
React, AI Analytics, Data Pipelines
2023 - Present
Consolidating the data workflow.
Dataxplorer was born from a vision to democratize data storytelling for mission-driven organizations. With over 20 years of combined experience in data and global health development, our team recognized a critical gap: organizations were struggling with fragmented workflows, bouncing between multiple tools to transform raw data into meaningful insights.
Dataxplorer aims to empower governments, nonprofits, and communities to work with data in a single place—uploading datasets, creating visualizations, and sharing insights without needing extra tools or technical expertise.
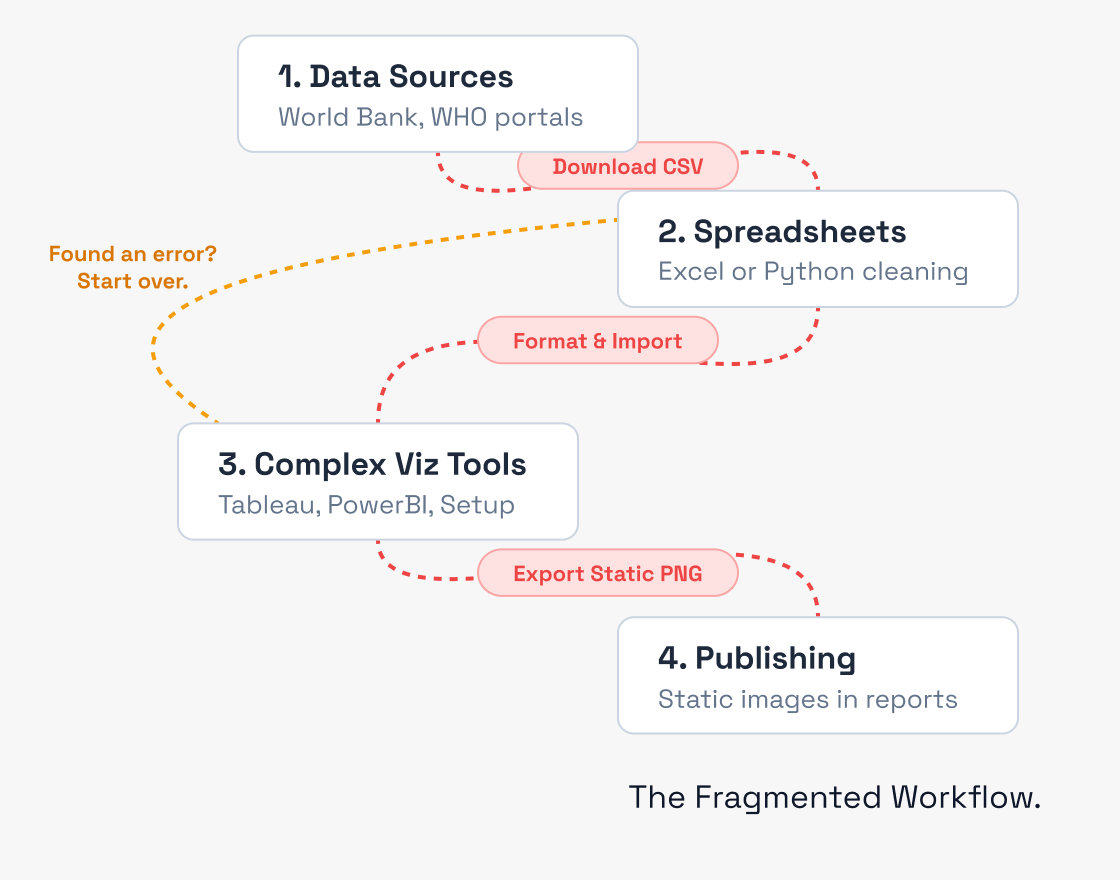
Too many tools, too much context switching.
Many teams in nonprofits, governments, and research organizations struggle with fragmented data workflows. They find datasets in one place, download and clean them somewhere else, then create charts in yet another tool. This disjointed process is time-consuming and inefficient. High-complexity tools have steep learning curves, while simple chart makers lack the ability to handle complex data integration.
The result is that mission-driven professionals spend more time wrestling with tools than making informed decisions.
Go from connected dataset to chart in one environment.
Dataxplorer was built on a simple premise: zero context switching. For mission-driven organizations, the path from raw data to a visual narrative is often frustratingly fragmented across multiple tools. Dataxplorer eliminates this friction by unifying the workflow, allowing semi-technical analysts to move from data acquisition directly to their first story without ever leaving the workspace.
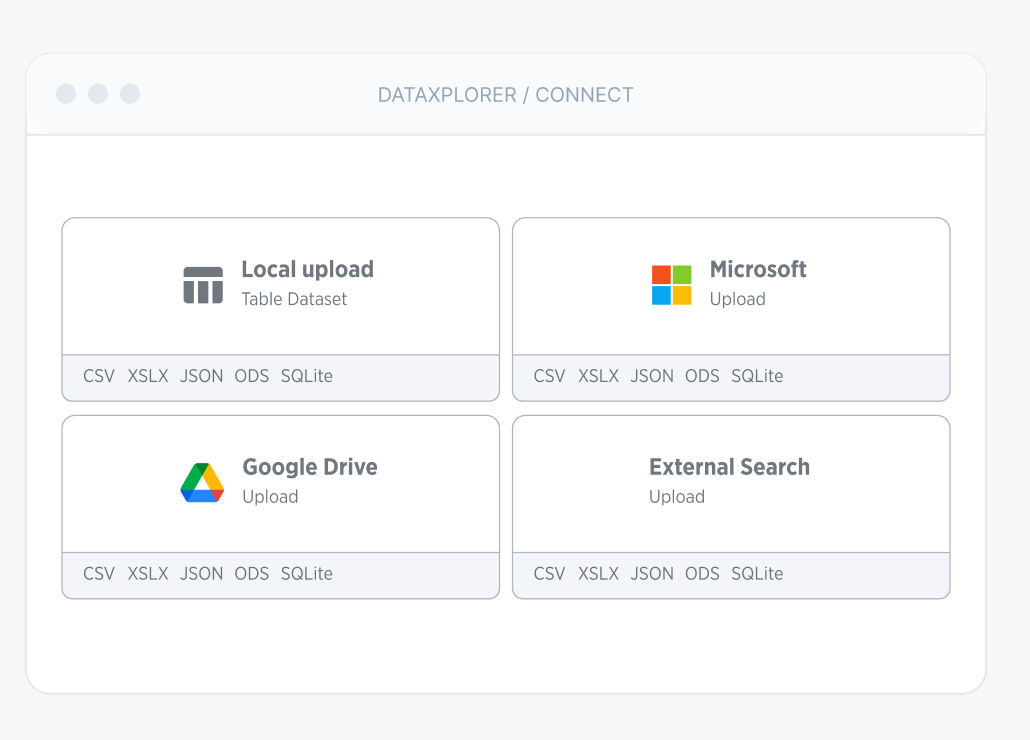
Centralized Data Access
Users can easily connect information straight to their workspace. The platform supports standard local uploads, direct cloud integrations (Google Drive, Microsoft Cloud), or a built-in discovery flow to search and import public datasets.
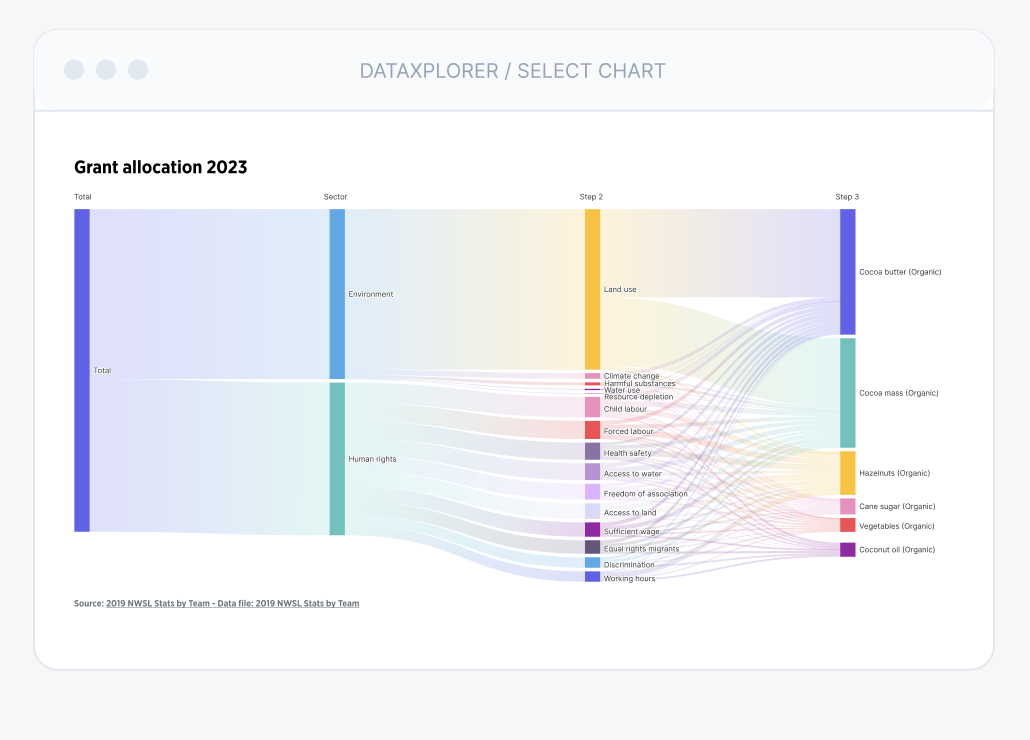
Charting and Visualising
Once data is connected, the transition into chart creation is immediate. To eliminate the friction of manual mapping, Dataxplorer analyzes the dataset properties and provides AI-assisted chart suggestions, recommending the most effective visualization types for the data at hand.
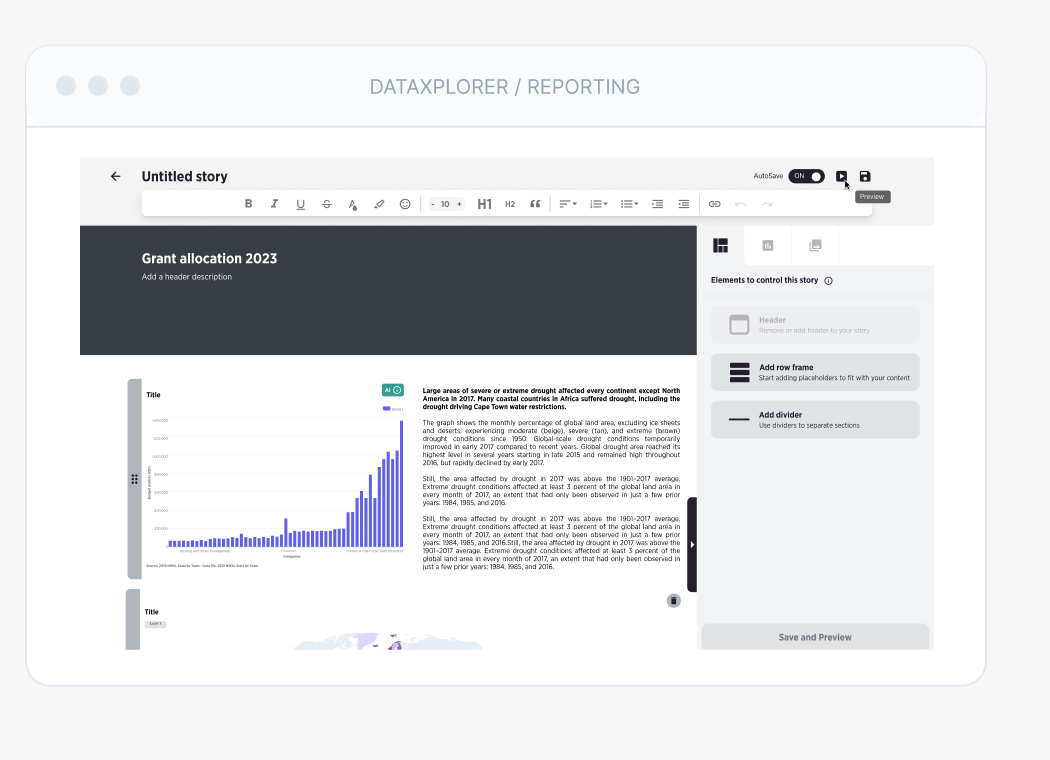
Interactive Storytelling
A single chart rarely tells the whole story. Within the same workspace, Dataxplorer’s built-in report builder allows analysts to drag and drop their newly created visualizations onto a flexible canvas. By assembling charts, context, and data points into cohesive narratives, teams can draft and share structured reports without ever shifting into external presentation tools.
Built for mission-driven professionals.
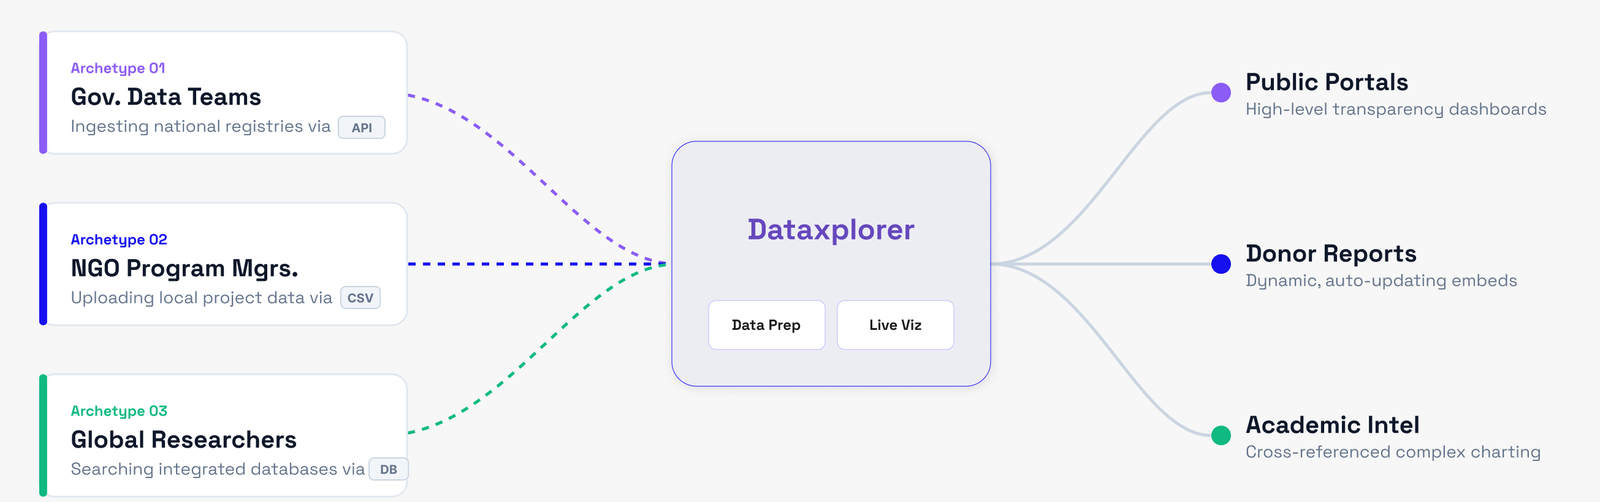
Dataxplorer is specifically designed for semi-technical analysts, researchers, and program professionals working in NGOs, governments, and community organizations. These users need to move from data source to chart quickly without coding. They value efficiency and integrated workflows over raw feature complexity, and they need a tool that “just works” without a steep learning curve.

Have a data platform or transparency initiative in mind?
We partner with public-good organisations to build the data infrastructure their mission depends on.