GLOBAL FUND DATA EXPLORER DASHBOARD · TRANSPARENCY
Visualising the global fight against AIDS, tuberculosis and malaria.
The public data platform of The Global Fund — making billions of dollars in health investments, grant performance and programmatic results explorable, comparable and accountable across 120+ countries.
The Global Fund to Fight AIDS, Tuberculosis and Malaria
Data Visualization, UI/UX, Front-end Dev
React, API Integrations, Nivo
2019 – Present
Where the money comes from, where it goes, and what it achieves.
The Global Fund has invested over US$65 billion since 2002 in the fight against three of the world’s deadliest diseases. The Data Explorer is the Fund’s primary public transparency platform — a web application that visualises pledge and contribution data from donors, grant financial data across all active and historical grants, and programmatic results at global, regional and country levels.
It serves a diverse audience: from Board members and donor governments tracking replenishment commitments, to researchers analysing disease-specific funding flows, to country teams monitoring grant performance and results against targets. We built it to tell the story of where investments come from, where they land, and what impact they deliver — across every country in the Global Fund portfolio.
US$65 billion in investments. No single place to understand them.
Prior to the Data Explorer, The Global Fund’s vast trove of financial and programmatic data was siloed across different internal systems, static PDF reports, and legacy web portals. For external stakeholders—whether they were journalists in Geneva or health ministers in Sub-Saharan Africa—piecing together a complete picture of an investment required downloading multiple datasets and attempting to reconcile them manually.
The challenge wasn’t a lack of data; it was a lack of a coherent narrative thread. The Fund needed a unified digital product that could seamlessly connect the upstream promises of donor countries (pledges) with the downstream realities of program execution (grants) and ultimate human impact (results), all while remaining performant and accessible on varying internet connections globally.
Six data dimensions. One coherent experience.
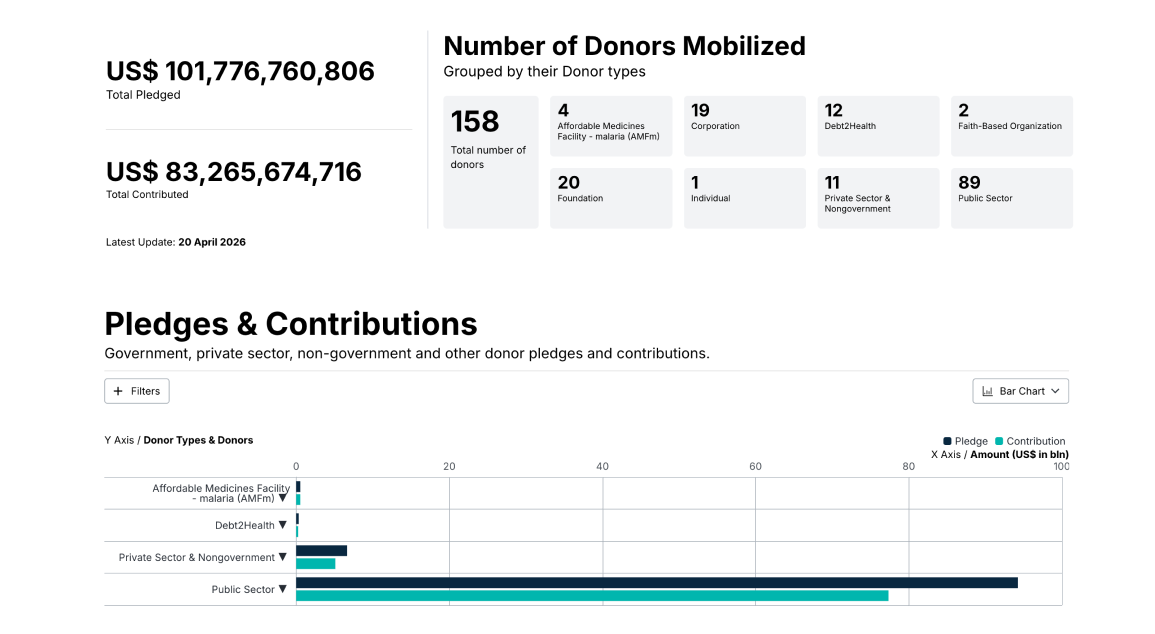
Resource Mobilisation
Explore donor pledges and contributions across all replenishment cycles to see how global commitments translate into actual disbursements.
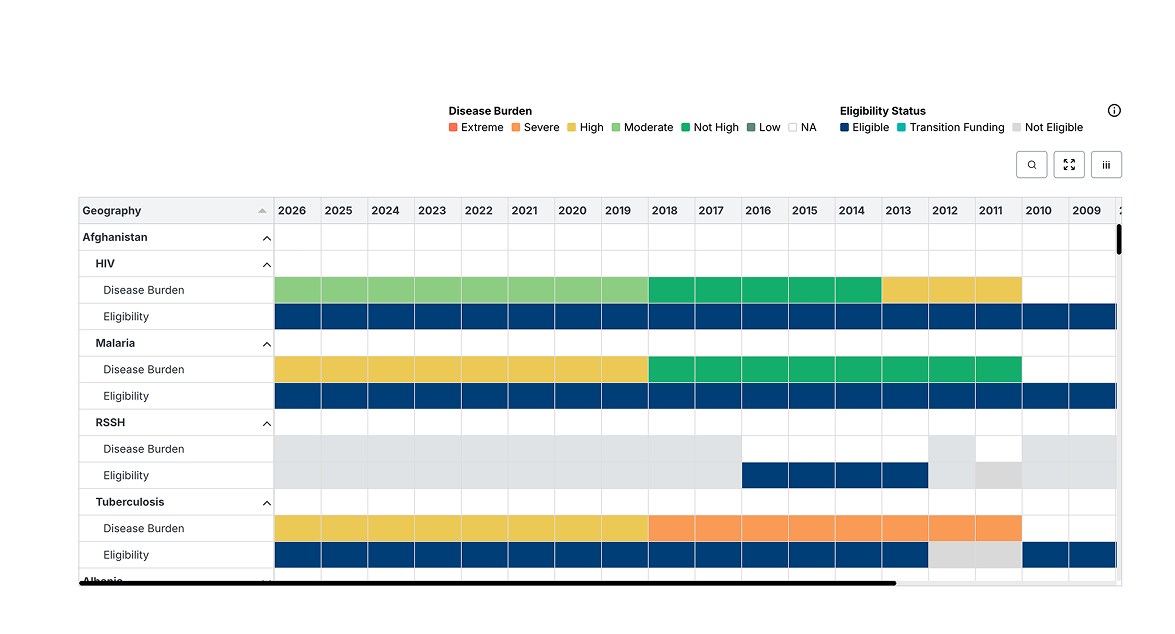
Access to Funding
Visualize funding allocations and eligibility across countries and regions, strictly broken down by HIV, TB, Malaria, and RSSH components.
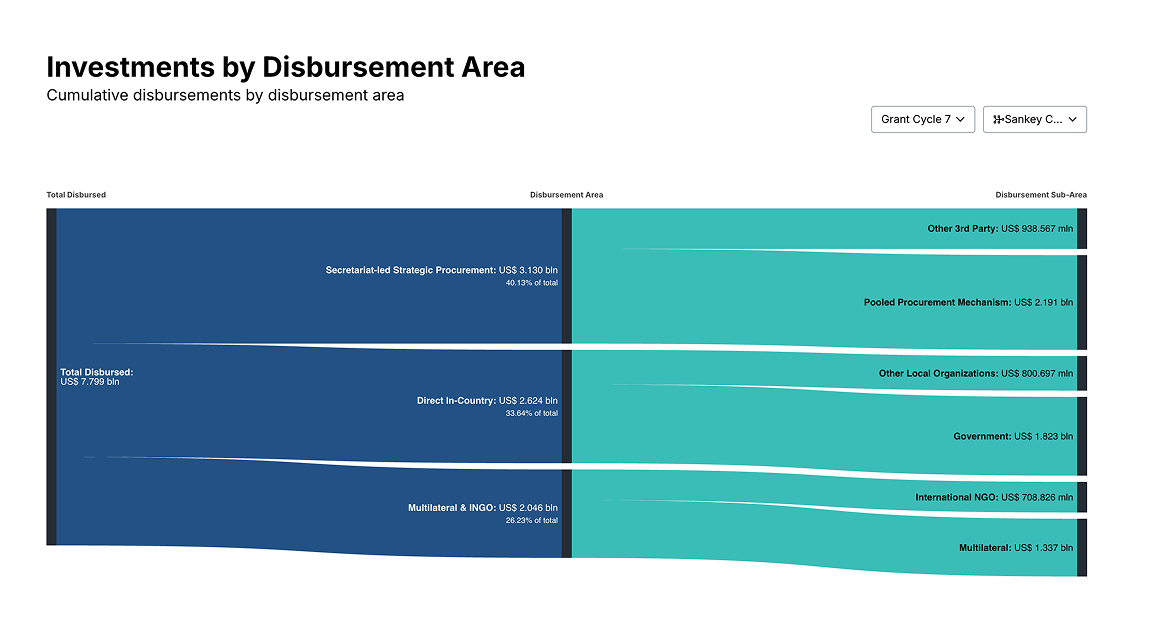
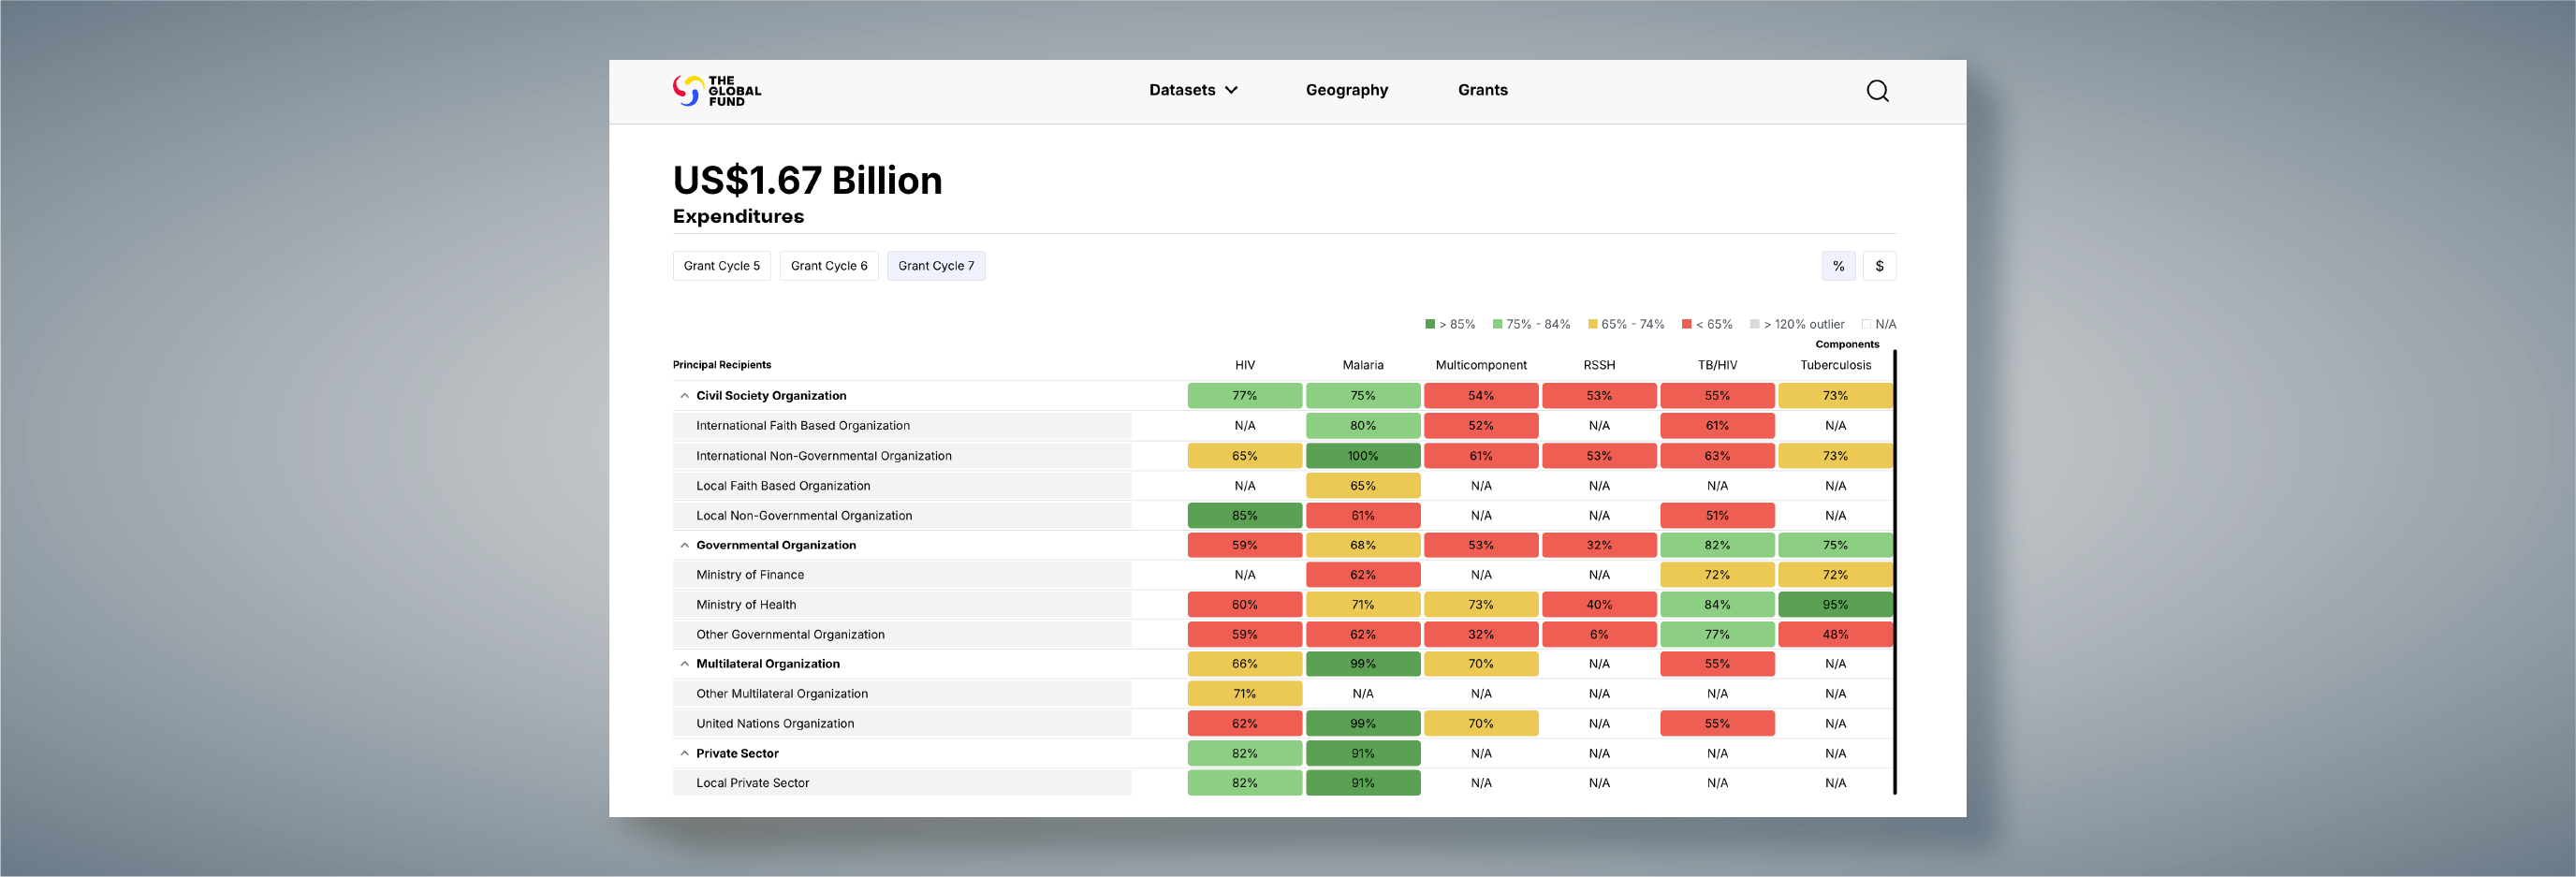
Financial Insights
Track the complete financial lifecycle of the portfolio by filtering signed grant amounts, formal commitments, and actual disbursements.
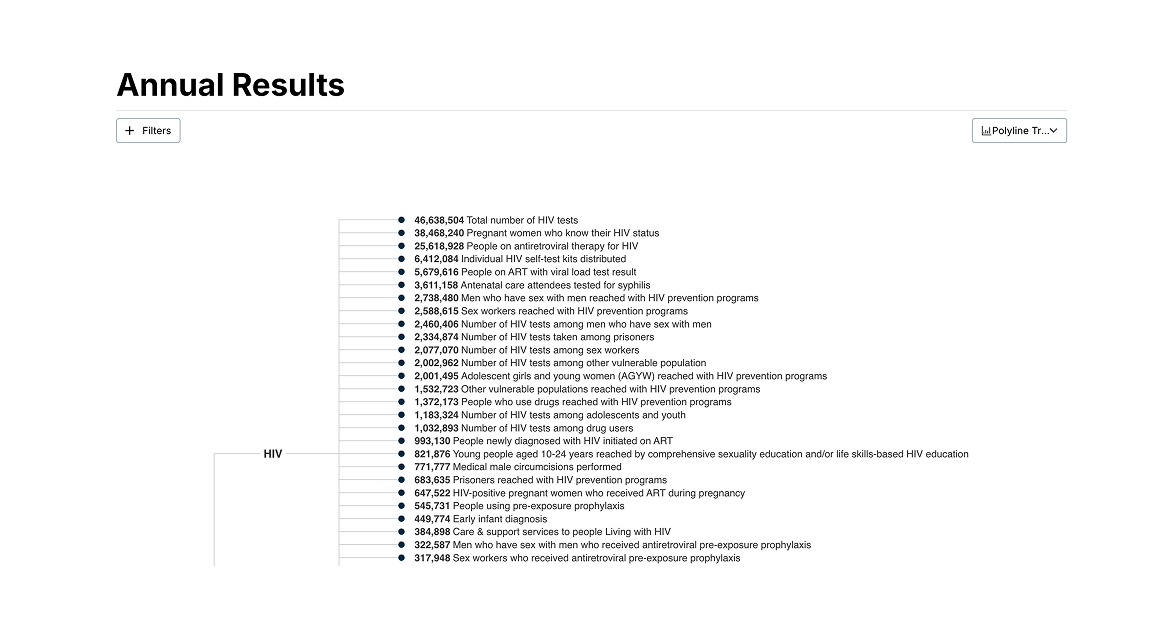
Annual Results
View programmatic health outcomes and year-over-year targets for core indicators at the global, regional, and country levels.
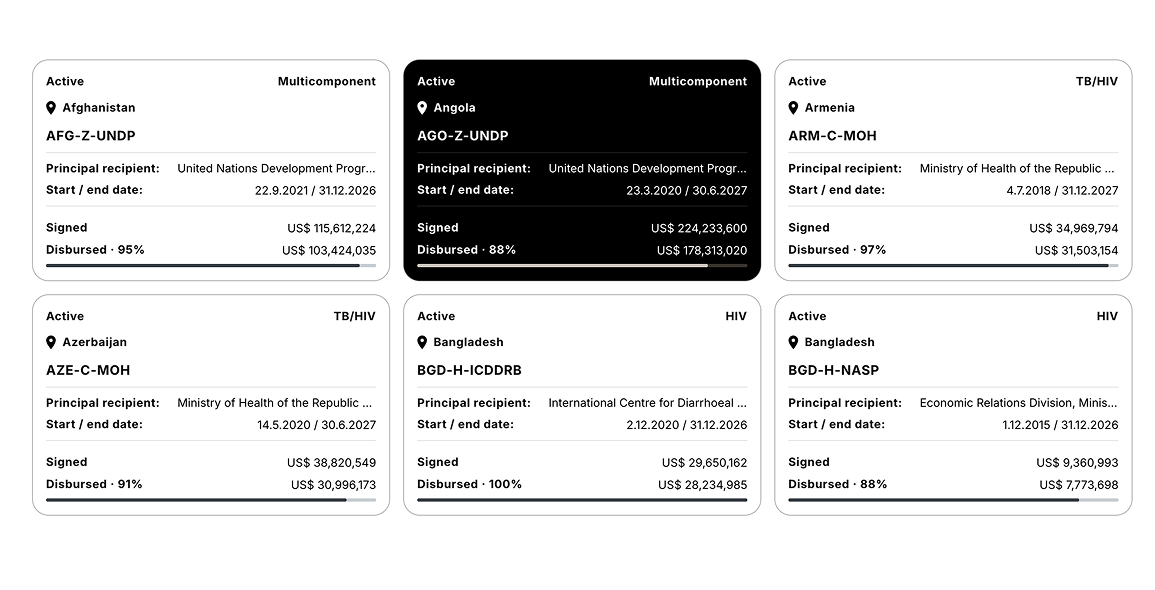
Grants
Examine the portfolio of active and historical grants to monitor implementation periods, Principal Recipients, and official performance ratings.
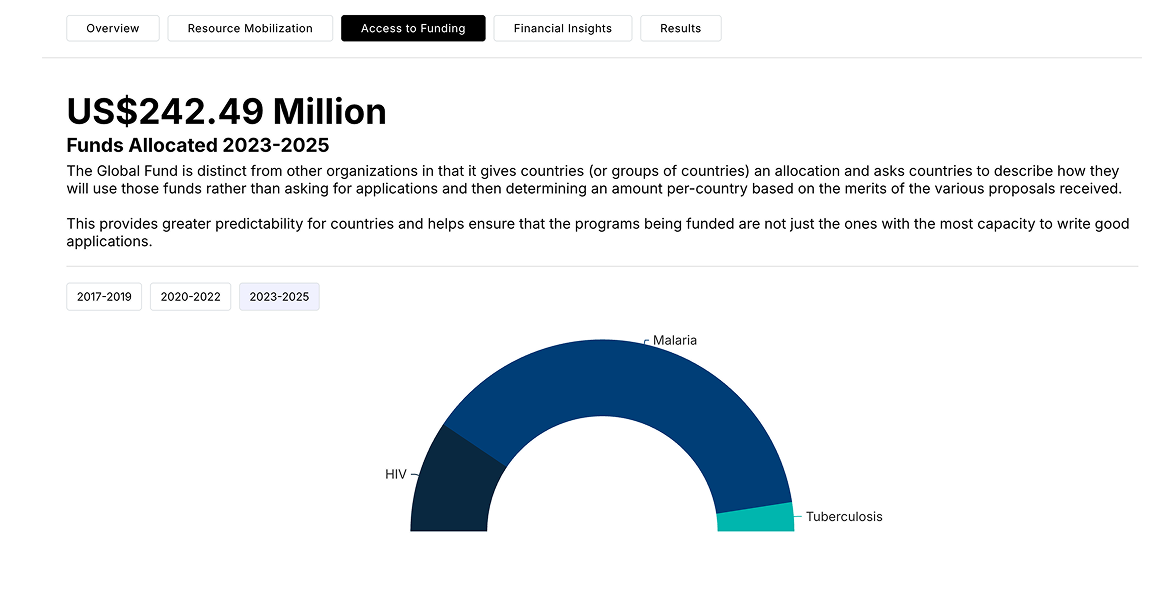
Geographic Location
Navigate a structured directory of regions and countries to explore localized allocations, grant lifecycles, and programmatic impact in one consolidated profile.
A connected part of a larger whole.
The Data Explorer doesn’t exist in a vacuum. It was designed to act as the central bridge within The Global Fund’s broader digital ecosystem—seamlessly pulling raw public registries from the Data Service API, while sitting alongside their Corporate governance site and Digital Media library.
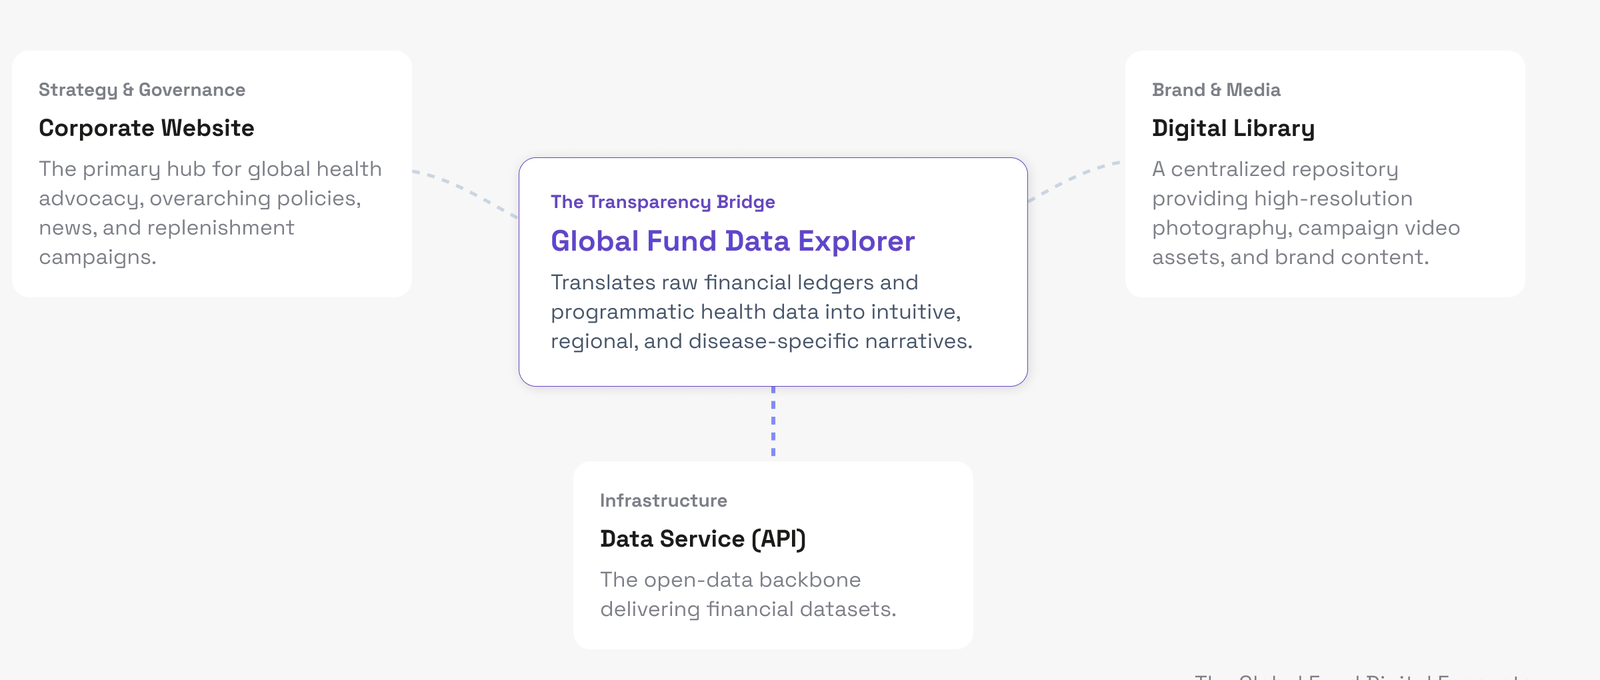
The Global Fund Digital Ecosystem.
The numbers behind the platform.

70M
Lives saved since 2002 through Global Fund-supported programmes

120+
Countries in the Global Fund portfolio

US$65B+
Total investments since inception

1,000s
Individual grants tracked across all cycles
* Data from the Global Fund Results Report 2025
Open source, API-driven, built to scale.
The Data Explorer is a fully open-source platform (MIT licensed) with a clear separation between frontend and backend. The React/TypeScript frontend handles all visualisation, navigation and filtering — powered by E-Charts for data visualisations, Mapbox for geospatial views, and a component library for consistent UI patterns.
The LoopBack 4 API serves as a data middleware layer, transforming the Global Fund’s raw Data Service into structured, queryable endpoints optimised for the frontend’s needs. A Strapi CMS manages all editorial content, giving the Fund’s team full control over page narratives and chart descriptions.
Engineering Excellence
The entire codebase lives under the Global Fund’s own GitHub organisation, with Cypress end-to-end tests, semantic versioning, and CI/CD pipelines ensuring quality across 118+ releases.
Seven years of building transparency together.
Zimmerman has been the Global Fund’s development partner on the Data Explorer since 2020. What started as a redesign of the Fund’s existing data portal has grown into a continuous, multi-year engagement spanning major platform upgrades, new data dimensions, and evolving user needs.
We’ve shipped features ranging from chart export functionality and performance framework views to the upcoming Report Builder — a custom reporting tool that lets country teams compose data narratives directly within the platform.
The partnership operates on a model of regular iteration: the Fund’s team identifies data and communication needs, we translate them into design and engineering solutions, and user feedback shapes the next cycle. It’s a relationship built on shared commitment to making global health data not just open, but genuinely useful.

Have a data platform or transparency initiative in mind?
We partner with public-good organisations to build the data infrastructure their mission depends on.